Hello everyone..
Good to be back on the blog, with a technical stuff this time.
A blog post specifically for Windows CE Application developers on “How to easily debug the WinCE 5.0 or 6.0 device applications“.
In the context of software development, debugging can be considered as an art and as said “Every art is incomplete without good & sophisticated tools“, there is no exception in this case too.
We face lot of troubles when our application crashes due to unhandled exceptions/Invalid memory accesses. In the absence of good tools, tracking the exact cause of these software errors in the code will take up your lot of development time and effort.
Microsoft Visual Studio with Windows CE tools provides run time debugging support. This will come for a great rescue when you are facing Data abort exceptions or application hanging. Also step by step execution enables you to find some of known/unknown/hidden bugs which are very difficult to trace in a manual debugging method.
This post explains the step-by-step procedure on “How to use the Visual Studio debugging tool to run/debug your standalone C/C++ application build for Windows CE 5.0 or 6.0 devices“. Debugging is possible even when your application is deployed and running on your WinCE device platform.
So here are the 4 simple steps after which you will start analyzing your code like never before!
Note: It is assumed that the reader knows how to download a WinCE image(NK.bin) to the target device either through EBOOT or by any other means.
Step 1: Setting the Project Properties:
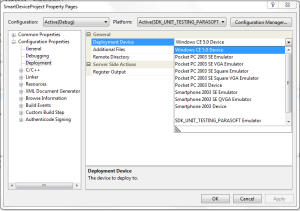
• Set the project properties by right clicking on your solution and selecting Properties.
• Select Deployment option under Configuration Properties. Select “Windows CE 5.0 device” as the Deployment device. Click OK to save the changes.
Step 2: Configuring the device options.
• Go to Tools->Options and select the Device Tools->Devices.
• Select Windows CE 5.0 device->Properties. Make sure the Transport is set as “TCP Connect Transport” and Bootstrapper is set as “ActiveSync Startup Provider”.
• Select the Configure and check “Use specific IP address”. Set this IP address as read from the target device. You can get the device IP address with “ipconfig” command.
Step 3: Preparing the device for connection
• Boot the device with your WinCE 5.0 or 6.0 image (NK.bin). Wait till default WinCE desktop comes up.
• Copy the following 6 Apps/Dlls from
C:\Program Files\Common Files\Microsoft Shared\CoreCon\1.0\target\wce400\armv4i
to
My Device->Windows folder in the target device.
1. Clientshutdown.exe
2. CMAccept.exe
3. ConmanClient2.exe
4. DeviceDMA.dll
5. eDbgTL.dll
6. TcpConnectionA.dll
• Start the connection by running following commands in sequence. Before that open the command prompt in the device and make your current directory as Windows with “cd windows” command.
Start ConmanClient2.exe
Start CMAccept.exe
After running CMAccept.exe, you should start debugging by connecting to the device.
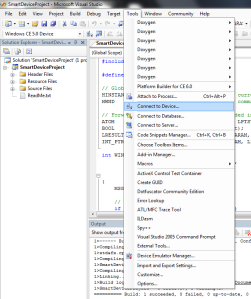
• Go to Visual Studio IDE and Connect to device from Tools->Connect to Device. For the first time connection, a dialog will open asking for the correct device. Select Windows CE 5.0 device and press Connect.
• A dialog box with Connection Succeeded message should be displayed. If any error messages are shown, try following.
1. Make sure the IP address of the target device is same as that set in the Device Properties (Refer Step 2).
2. Run the ConmanClient2.exe and CMAccept.exe applications in the target device again. Then try reconnecting the device.
Step 4: Start Running/Debugging the application
• You can put breakpoints at any place in the application, just go to the line and press F9.
• Start debugging by Debug->Start Debugging or by pressing F5. This will compile your application again(if any changes) and load the generated exe to the target device and run.
• You can also do step by step debugging by pressing F10 or stepping into/ stepping over a block of code by pressing F10 and F11 respectively.
• You can stop the debugging by Debug->Stop Debugging.
• If there any run time exceptions, the debugger automatically points the place of exception with Call Stack details.
Hope this method helps programmers out there trying really hard to make their application stable on different processor platforms.
Please get back to me if you find any problem trying out this method.
Best of Luck!


